Scale: The Universal Laws of Growth, Innovation, Sustainability, and the Pace of Life in Organisms, Cities, Economies, and Companies by Geoffrey West
Scale (2017) is a general audience (for the “intelligent layperson”) book which relates the author’s - a physicist at the Santa Fe Institute - research into the life sciences and later into cities, and as such is hard to categorize under a single topic or thesis. We could look to the title, which refers to scaling laws or power laws. That is, relationships of the form y = k*(x^s) as opposed to linear relationships y = mx + b. Or we could look to the subtitle, The Universal Laws of Life, Growth, and Death in Organisms, Cities, and Companies. My own irreverent-but-not-irreverent characterization is that, in addition to describing a certain branch of science called complexity theory, this is a book which argues biologists, economists, sociologists, etc. should think more like physicists. The dominant thread in Scale involves simple mathematical rules showing up in unexpected places – a hidden order where one would expect lots of statistical noise. With respect to certain properties all mammals are scaled versions of each other, as are all birds, as are the cities of a given country, as are companies. It’s a bold claim, particularly the latter two items (biology experts may already know about scaling between animal species), but West backs it up.
A heads up – many of the books reviewed on this blog have a single, well-defined thesis that they argue for the entire book. Scale is not that. This is partly because it is a layperson-level summary of research, and partly because it moves around a lot. In some ways it is one of those books like Godel, Escher, Bach where you end up with a mix of things that all happen to be in the author’s head, and you can understand how they’re connected if you read it but trying to explain it concisely is a challenge. I am writing this review mostly to share some of the phenomena described in it, but there are a couple of debatable ideas and I will comment on those.
I
Before getting into the core topics of the book, West provides several samples and preliminaries. To highlight one, consider drugs. If you know how much of a drug constitutes a dose for an adult human, how much should you give to something that’s larger or smaller than the adult human? There is no simple answer to this question, but we can talk about estimates. If you were forced to come up with a rough guess for how to change the dosage, you would probably assume that drug dosage is proportional to body mass, i.e. if a 6 lb baby should be given 40 mg doses of Infants’ Tylenol, then a baby weighing 36 lb should be given doses which are 240 mg – weight multiplied by 6 means dosage multiplied by 6 as well. Of course, this is the kind of simple question that only gets brought up if the natural response happens to be wrong. And indeed,
“However, regardless of details, an understanding of the underlying mechanism by which drugs are transported and absorbed into specific organs and tissues needs to be considered in order to obtain a credible estimate. Among the many factors involved, metabolic rate plays an important role. Drugs, like metabolites and oxygen, are typically transported across surface membranes, sometimes via diffusion and sometimes through network systems. As a result, the dose-determining factor is to a significant degree constrained by the scaling of surface areas rather than the total volume or weight of an organism, and these scale nonlinearly with weight.”
If the length/height of a 3D entity increases by a factor of c, then surface areas increase by c^2 and volume by c^3, assuming the thing stays proportional to what it was before. The relationship between size and dosage of various drugs is not as clean as some of the other results in the book, so.. don’t try this at home. But, if you absolutely had to estimate the dose of a drug, and you knew the appropriate dose for someone (or some animal) of a given size, you could use a scaling law with an exponent of 2/3. If you’ve calibrated baby Tylenol dosage for a 6 lb baby and you know that the correct dose is 40 mg, then for a baby which is 6 times as large the dose should be 6^(2/3) times as large – this comes out to about 132 mg, around half of the uninformed estimate of 240 mg. And to reiterate, don’t try this at home, because it’s a meant to be a familiar example to get across the general idea of scaling laws rather than medical advice, and the scaling law here isn’t that accurate anyway. But, this example is not made up. West pulled those numbers off the bottle. He notes that the company’s website “now wisely [recommends] that a physician be consulted for babies less than 36 pounds”, but that “Nevertheless, other reputable Web sites still recommend linear scaling for babies younger than this”.
Perhaps there is some hidden reason for the linear scaling of Infant Tylenol dosage. But West provides another story of failure to understand how doses should scale. In 1962 two psychiatrists and a zoologist attempted to study the effects of LSD on elephants. It was not clear, however, how much LSD should be injected into an elephant. The solution they came up with was to take a dose suitable for a cat and assume that a dose should be proportional to body weight - a linear relationship. I filled in some math based on the average weight of each animal and came up with an estimate that this is 8 to 12 times more than what West says their estimate ought to have been. The results: “Poor old Tusko died an hour and a half later. Perhaps almost as disturbing as this awful outcome was that the investigators concluded that elephants are ‘proportionally very sensitive to LSD’.” This study was published in the elite journal Science.
II
So, if you’re looking for how two quantities relate, the impulse is to assume a simple ratio y = k*x. But instead it might look like y = k*(x^s). What can we describe with y=k*(x^s)? Most of what’s in the rest of the book.
Start with animals. What is the metabolic rate (how many calories does it eat each day) of the average member of a given species? You would probably expect a given cell to take the same amount of energy for maintenance regardless of how big the animal is, and thus be proportional to the mass of the animal. Alternatively, through the power of context and leading questions you’ve guessed that metabolic rate scales like a power law with an exponent other than 1. This would be correct. The exponent is ¾. What about heartbeat, or life expectancy? The number of heartbeats across an entire lifetime is roughly invariant across any taxonomic group – every mammal from rats to dogs to whales has about 10^9 heartbeats in the course of its lifetime (humans have far more but that is due to medical technology). Heart_rate_, however, decreases systematically with increasing size, with an exponent of about -1/4. There is a corresponding increase in life span, and in age until maturity. The ratio of white and grey matter in the brain, too, fits into a scaling law with an exponent of about ¾. What’s even more striking here is that the models are quite accurate. The biologists call them allometric scaling laws. West says that biologists have known about scaling since before 1900, and that the pattern was well-documented by Max Kleiber in 1932. But with a couple exceptions, they by and large did not ask the right questions: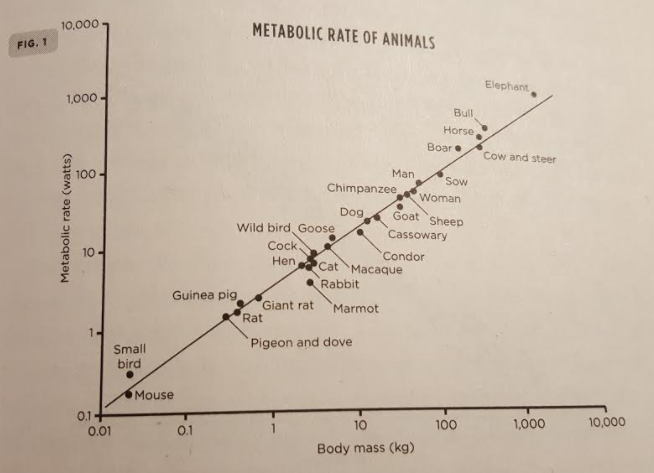
“In the 1980s several excellent books were written by mainstream biologists summarizing the extensive literature on allometry. Data across all scales and all forms of life were compiled and analyzed and it was unanimously concluded that quarter-power scaling was a pervasive feature of biology. However, there was surprisingly little theoretical or conceptual discussion, and no general explanation was given for why there should be such systematic laws, where they came from, or how they related to Darwinian natural selection.”
“As a physicist, it seemed to me that these ‘universal’ quarter-power scaling laws were telling us something fundamental about the dynamics, structure, and organization of life. Their existence strongly suggested that generic underlying dynamical processes that transcend individual species were at work constraining evolution. This therefore opened a possible window onto underlying emergent laws of biology and led to the conjecture that the generic coarse-grained behavior of living systems obeys_quantifiable_ laws that capture their essential features.”
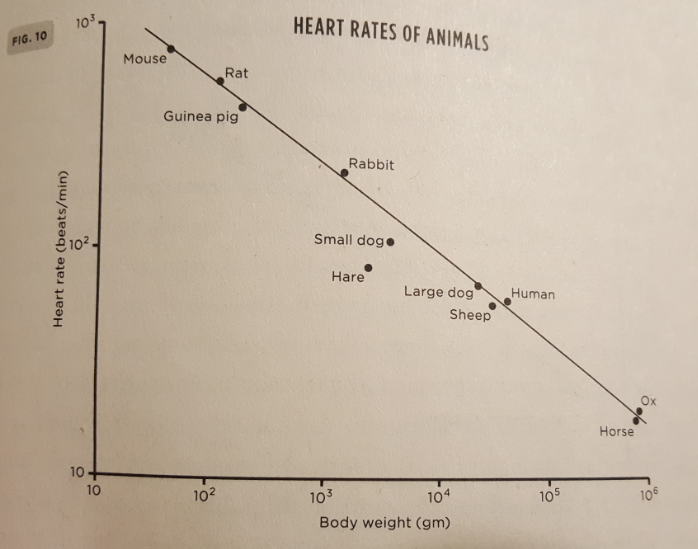
There’s a criticism of biologists here and … unless West happens to be outright wrong about the facts it seems to be well-founded. Can a biologist or someone from a related field weigh in here? How does any researcher look at that kind of data and not ask why? The book quotes a Nobel Prize winner from biology, Sydney Brenner, who said roughly the same thing about his own field: “drowning in a sea of data and thirsting for a theoretical framework with which to understand it…”
I’ve probably given you all an impression that Geoffrey West has an ax to grind against biologists. He doesn’t, sort of – he tells us a younger version of him did have such an ax but it’s a friendly thing now. What he does do stress a prescription for research, that it should be more multi-disciplinary and not conducted in silos. This too seems quite reasonable? Clearly there is a need for researchers to spend a long time figuring out highly specific and technical answers to highly specific and technical questions, but it doesn’t do a lot of good if nobody puts together a broader picture. Moreover, it’s ideal if the broader picture is something that more than 200 extremely specific people in the world can actually understand and follow. Besides the benefit of diverse perspectives/methodologies/yada yada, I’m willing to bet that having more multidisciplinary research would help with the dispersion of ideas. Maybe with more communication between fields, pharmaceutical companies wouldn’t have made an apparently elementary error like assuming that medicine dosage should be proportional to mass instead of surface area. There is something of a motif in Scale where Geoffrey West recounts stories of professionals or researchers getting something badly wrong, usually because they missed something that was basic knowledge to another field. It’s a theme which I’ve chosen not to focus on for this review, but examples include the Millennium Bridge falling victim to resonance, BMI being a patchwork of linear relations instead of using a scaling law, and the discovery of fractals’ ubiquity being delayed for 15 years because the original discoverer (Lewis Richardson) buried it in an appendix to an unrelated article.
III
So, in the mid 90s Geoffrey West sees scaling in animals and because he’s a physicist he wants to craft a grand theory that explains why this happens. He teams up with biologists James Brown and Brian Enquist, and they give each other a crash course in their respective fields and methodologies. There are some culture shocks, etc., and over the course of the next few years they discover and publish in articles their theory about why there are scaling laws among taxonomic groups. The book goes on to outline that theory.
Repeating the quoted passage from earlier, let’s make note of a truism. Evolution optimizes. Metabolic rate is the amount of energy a creature has to imbibe to maintain itself and continue living. If there was a way for a given species to become more energy efficient, to eat less while not sacrificing fitness in other areas, we would expect evolution to find it. The scaling for metabolic rate with respect to size, and its accuracy, strongly suggests that there is some physical law which at some point constrains how energy efficient an animal of a given size can be. The fact that so many of the exponents are close to fractions with a denominator of 4 strongly suggests that the number 4 has some fundamental importance here. What might that law and that importance be? To answer this we need to talk about fractal geometry. This is probably familiar, but here’s a quick review:
For most people the word “geometry” brings to mind Euclidean geometry. This is the world of straight lines, perfect circles, right angles, etc. Or, more broadly, it is the world of smooth surfaces which can be approximated by straight lines should one zoom in far enough. However, while this paradigm does an excellent job of measuring and describing objects built by humans, it is decidedly less excellent at measuring and describing a number of objects in nature, which are recursive or which have detail “on many scales”.
The canonical example, dating back to Mandelbrot’s 1967 paper, is a coastline. Look at a coast, say that of Norway, on a world map. It is best described as “crinkly”. Look at a map that is of Norway alone and it is still crinkly; the zoomed-in map captures features which the world map did not. Zoom in further and it will exhibit yet more features not visible on the maps with a larger scope and lower resolution. In the real world we can’t do this indefinitely; at some point we reach the resolution of atoms. But there is a broad range of scales at which we could look at the coastline and see interesting patterns. The same applies to broccoli, to river deltas, and to stock price charts: a stem of broccoli is rather like a smaller copy of the entire head, financial charts on the scale of minutes or of weeks look about the same if you remove the numbers from the axis, and if you zoom in on a picture of a delta you end up looking at something similar to what you were looking at before.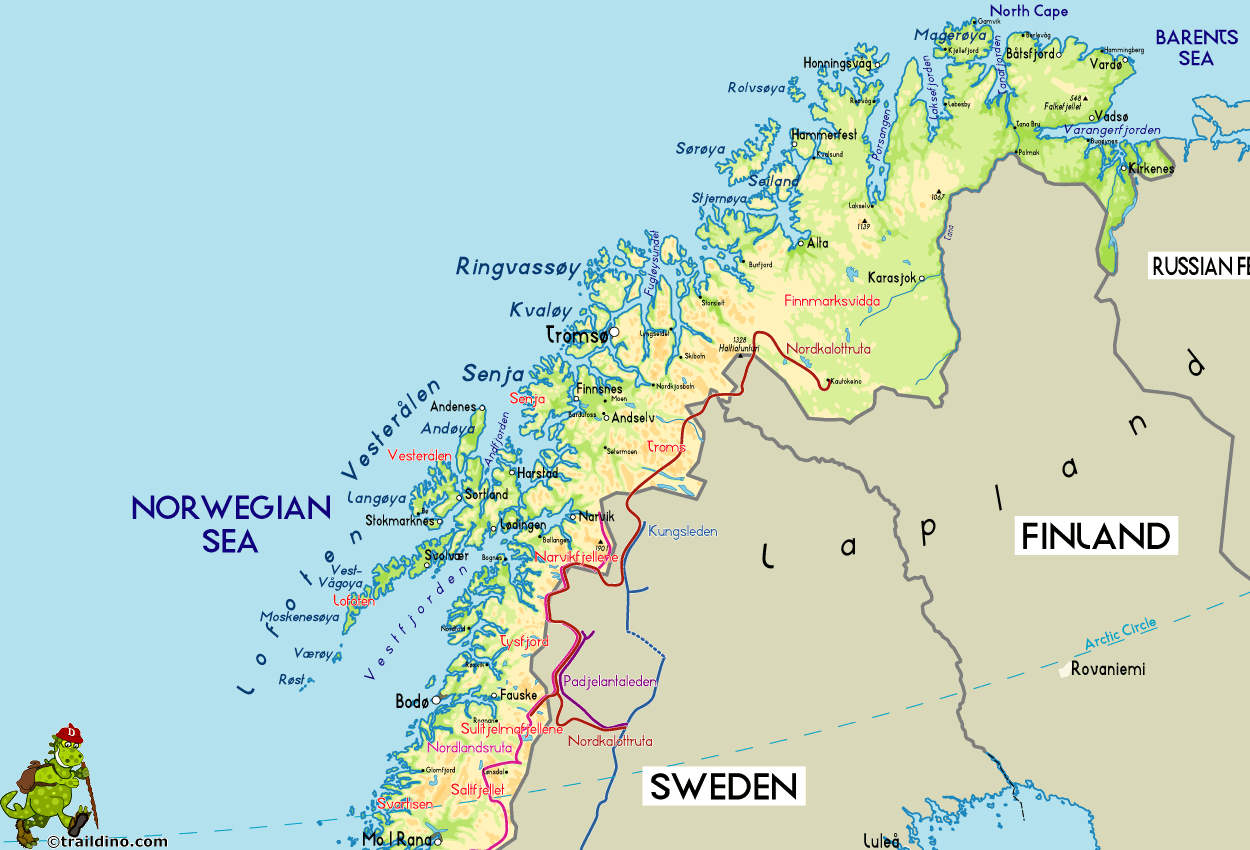
The connection between fractals and power laws is that the former is one source for the latter. To understand this, think back for a moment to the Euclidean world. Suppose one doubles every side of a square. The area of the square itself, a 2-dimensional object, is multiplied by 4 = 2^2. Double every side of a cube, a 3-dimensional object, and the volume is multiplied by 8 = 2^3. If we allow this observation to serve not as a consequence but rather as the definition (or, to be pedantic, the motivation for an expanded definition) of dimension, then we can have dimensions that are numbers other than 1,2,3,… . The fractal dimension is how much bigger the object gets if you scale it up. Or for the real-world examples, fractal dimension tells you how much longer/larger you’re going to measure for a quantity if you use a more fine-grained measurement and capture more of the crinkles with your measuring stick or equivalent.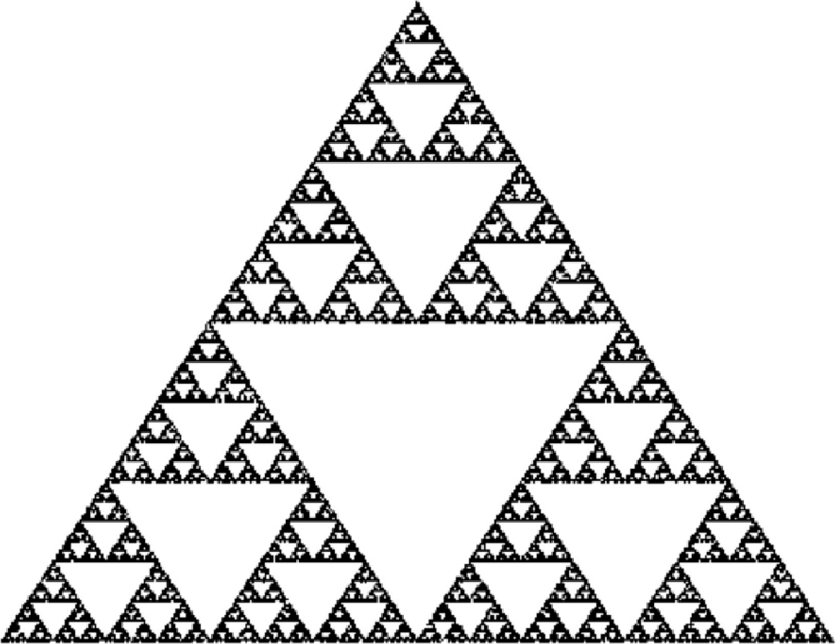
This brings us to a counterintuitive idea, that there can be a distinction between the dimension in the sense of taking n parameters to describe a location within the object, and dimension in the sense of how much bigger the object gets if you scale lengths. Or to go with a less correct but more intuitive explanation, imagine a flat two-dimensional sheet that you have made so crinkly, on scales going all the way down, that it manages to have something like volume. The bizarre mathematical construct that is Hilbert’s space-filling curve turns out to have real-world relevance.
The type of fractal that matters here is a branching network, i.e. the circulatory system. Blood starts out pumped by the heart, and goes out through the aorta. The aorta then branches off into arteries. Those arteries branch off into other arteries, which eventually branch into arterioles and then finally into capillaries, which must reach every cell. Then the same thing happens in reverse, from bottom up. Nature’s fractals aren’t infinitely detailed, but if we just look at the first couple steps after the heart, the system doesn’t much change each time we branch off into a smaller vessel. And if we compare animals of two different sizes, the main difference between their circulatory systems is the number of branching steps it takes before bottoming out into capillaries.
In terms of length the circulatory system is very, very large - about 60,000 miles for an adult human. But from the fractal viewpoint, length isn’t quite the correct perspective to take. Instead we need to think about the fractal dimension. Remember Hilbert’s space-filling curve? Blood vessels exist in three-dimensional space. But they are so detailed and branching that they can be thought of as having almost an extra dimension to them, through the power of fractal geometry. Disclosure: West’s actual analogy doesn’t involve Hilbert, but rather two-dimensional clothes in a three-dimensional washing machine. Either way, I have to admit that the analogy doesn’t 100% make sense to me – Hilbert’s line or crumpled clothes in the wash actually exist in the extra dimension they’re filling, and with blood vessels the fourth dimension is more like a metaphor rather than something they literallyfold branch into and fill. I assume West is sparing us a much more complicated mathematical analysis. The basic idea that you get more use out of space if you have a highly detailed, intricate network is simple enough, but why the scaling exponent should be exactly 4 – key for being the number of dimensions we live in plus 1, according to the book – is not something I feel comfortable expositing. If you’re sufficiently curious, look up his team’s paper, The Fourth Dimension of Life (1999).
The fractal-based theory ends up doing a great job of predicting several quantities related to blood vessels, as well as the analogous structures in flora. It also does a good job of predicting those big-picture quantities mentioned earlier, like growth curves and metabolic expenditure per cell. Hearts across all mammals maintain the same blood flow – speed and pressure. If we scale up an abstracted mammal, the circulatory system experiences predictable gains in efficiency. A horse’s heart does not have to work as hard in an hour as does a rat’s, although over the course of their respective lifetimes both hearts do around the same amount of work.
The theory can do even more. It can predict the size of the smallest mammals. The key to this prediction is that large blood vessels and very small blood vessels – capillaries – do not function in the same way. Your arteries have a pulse emanating from the heart. But after they branch enough times and become sufficiently narrow the pulsatile system isn’t efficient; instead blood flow is steady at the lowest levels. West compares it to DC vs AC electrical current. And crucially, the tipping point between pulsatile and steady doesn’t depend on the size of the animal; all that the size affects is how many steps there are before we reach the tipping point. Another way to put this is that arteries are fractal but capillaries are not. Shrews are among the smallest mammals; they only have one or two layers of artery before bottoming out into capillaries. A mammal that was any smaller would have a design based on a heartbeat but would have no pulse because its entire circulatory system would be based on steady flow. Such a design would be inefficient, and so it doesn’t occur.
Briefly: West and co. are also able to say something about upper limits to size using the network viewpoint. As an animal gets larger, the capillaries very slowly (exponent 1/12) become further apart from one another. If they spread too far apart, they don’t actually supply every cell and this hypothetical animal is interspersed throughout with cells which have no oxygen. Now, for land animals we’re probably best off to ignore this and instead just make note of the square cube law – that the strength of limbs scales like a square and the mass of the things they’re supposed to be holding up scale like a cube – but the network theory is able to predict something near the size of the blue whale as the largest possible mammal.
IV
The first half of Scale talks about an aspect of biology which was already known, but not widely cared about or well-understood, and it both popularizes what came before and advertises the author’s own contributions. Certainly biological allometry was not known to me, but since I have not taken biology since high school that is not too surprising. (Although, if the various pre-med students I knew in college learned this fact and never brought it up at gatherings, I’m disappointed, because I think it’s pretty cool.) The second half of the book leaves biology behind, except as an analogy. West uses a metaphor – that of the city as a living entity – to motivate research. After all, scaling laws in biology came down to rules governing how infrastructure scales as a body gets larger, and cities have infrastructure too - pipes and roads and electrical wiring instead of blood vessels and the respiratory system. There was a researcher in Germany named Dirk Helbing who had looked at scaling in cities back in 2004; Geoffrey West recruited him and others into a collaboration to revisit and expand upon these ideas. The fact that there is a second half of the book suggests that the findings are going to be interesting, and indeed they are. Just as there were several biological quantities which one could predict for any mammal knowing only its mass, there are several quantities pertaining to cities which one can predict knowing only the population and the country in which it’s located. (The models only compare the cities of one country to each other. It turns out that for this set of y = k*(x^s), k depends on the country you’re in and s does not, making country rather like taxonomic group in the analogy)
“Regardless of the specific urban system, whether Japan, the United States, or Portugal, and regardless of the specific metric whether the number of gas stations, the total length of pipes, roads, or electrical wires, only about 85 percent more material infrastructure is needed with every doubling of city size. Thus a city of 10 million people typically needs 15 percent less than of the same infrastructure compared with two cities of 5 million each, leading to significant savings in materials and energy use.”
“This savings leads to a significant decrease in the production of emissions and pollution. Consequently, the greater efficiency that comes with size has the nonintuitive but very important consequence that on average the bigger the city, the greener it is and the smaller its per capita carbon footprint. In this sense, New York is the greenest city in the United States, whereas Santa Fe, where I live, is one of the more profligate ones. On average, each of us in Santa Fe is putting almost twice as much carbon into the atmosphere as New York. This should not be thought of as somehow reflecting the greater wisdom of New York’s planners and politicians, nor as the fault of Santa Fe’s leadership, but rather as an almost inevitable by-product of the dynamics underlying economies of scale that transcend the individuality of cities as their size increases. These gains are mostly unplanned, though policy makers in cities can certainly play a powerful role in facilitating the enhancing the hidden ‘natural’ processes that are at work. In fact, this is a large part of what their job is. Some cities are very successful at doing this, while others are much less so. …”
“These results are very encouraging and provide powerful evidence in support of the quest for a possible theory of cities. However, of even greater significance was the surprising discovery that the data also reveal that socioeconomic quantities with no analog in biology such as average wages, the number of professional people, the number of patents produced, the amount of crime, the number of restaurants, and the gross urban domestic product (GDP) also scale in a surprisingly regular and systematic fashion …”
“Also clearly manifested in these graphs is the equally surprising result that all the slopes of these various quantities have approximately the same value, clustering around 1.15. Thus these metrics not only scale in an extremely simple fashion following classic power law behavior, but they all do it in approximately the same way with a similar exponent of approximately 1.15 regardless of the urban system.”
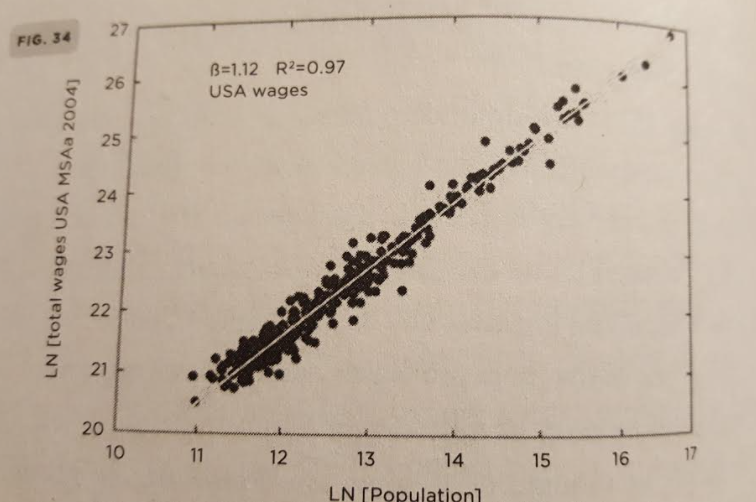
(The wages aren’t adjusted in any way for standard of living, but it is still noteworthy, and perhaps there is some insight about inflation lurking here. Or perhaps it is telling us about the concentration of the wealthy; West does use total wages rather than take a median.)
Later on:
“These results are pretty amazing. We typically think of each city, and especially the one we live in, as being unique … Boston not only looks different but also ‘feels’ different from New York, San Francisco, or Cleveland, just as Munich looks and feels different from Berlin, Frankfurt, or Aachen. And they do and are. But who would believe that within their own urban systems they are approximately scaled versions of one another, at least as far as almost anything that you can measure about them is concerned? If you are given the size of a city in the United States, for example, then you can predict with 80 to 90 percent accuracy what the average wage is, how many patents it’s produced, how long all of its roads are, how many AIDS cases it’s had, how much violent crime was committed, how many restaurants there are, how many doctors and lawyers it has, et cetera. Much about a city is determined simply by its size.”
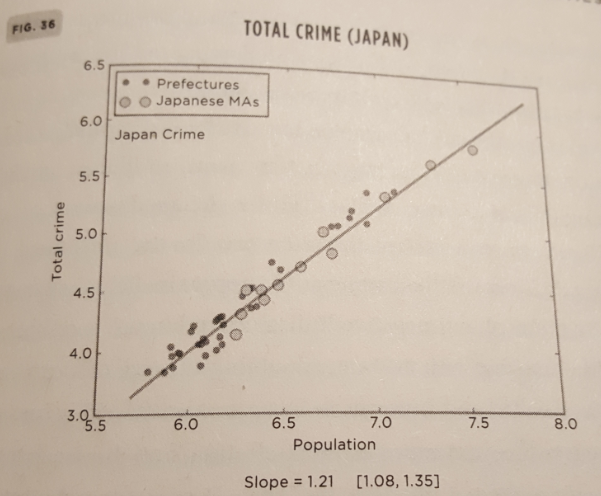
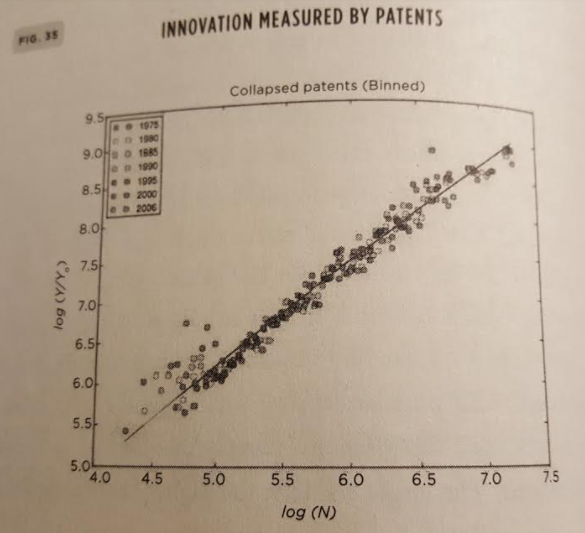
Log of population against log of crimes, Japanese cities
That larger cities have more criminals and more inventions per capita is in itself not at all surprising. What’s incredible here is the accuracy. The figure plotting the logarithm of total wages in a city vs. the logarithm of population is a line with R-squared equals 0.97! I will admit to picking this one because the fit is especially good, and not all of the plots have an R-squared printed with them, but based on eyeball analysis this model is excellent even before one takes into account its extreme simplicity.
So why does this model work, and work better than it has any right to? “A faster pace of life” perhaps, or by analogy perhaps increasing the size of a city as raising the temperature of a gas and so increasing the number of collisions between the particles. In truth the question is not answered in a detailed or mathematically rigorous fashion, though not for lack of interest. The most promising direction for a rigorous explanation appears to be the rate at which interactions between humans happen. West tells us about phone call data: The amount of time spent on reciprocated phone calls scale with population, with an exponent of about 1.15. And that’s reciprocated phone calls, meaning that both people called each other within some time frame. If one includes the non-reciprocated phone calls such as sales pitches the exponent is even higher; West doesn’t say by how much. For those curious, this particular study was done in 2014.
It’s definitely plausible, but not completely convincing. West’s team explores a natural hypothesis: We know that the maximum number of contacts a person can have, with varying degrees of closeness, is a human constant that doesn’t depend on culture or the number of people in their settlement – see Dunbar numbers. But what about the number of your friends and acquaintances who know other friends and acquaintances of yours? Perhaps it is lower if you live in a city, because you have more spheres and so less chance for two of your friends to know each other? But, no. The team doesn’t find any individual-level differences in social circles that change with population density.
All the same, my priors tell me that there must be something here, and West seems to agree. He speculates about cities being diverse because they are large, and that this helps people be able to find others who are very similar to them. My own nebulous thoughts involve the idea that population-dense areas are good if you want to do business (in a general sense of the word) but not if you want to, say, raise children. I’m sure an entire book could be written summarizing different hypotheses and the status of the research here, but I’m hoping that if a solid answer was known that West would have heard about it and mentioned it.
(Also, I have to wonder how the Internet age affects all of this. You can use Zoom from just about anywhere in the developed world, and the quality of the communication is the about the same, regardless of how dense of an area you’re in.)
V
Moving on from the inconclusive discussion that comes from “Why?”, let’s consider something else. If doubling the size of a city leads predictably to a 15% increase in the GDP per capita and the crime rate, and a 15% savings in the per capita cost of infrastructure networks such as roads, water systems, etc. then per capita measures are a poor benchmark for comparisons between cities. New York City would be at or close to the superlative in everything, simply for being the biggest city in the American urban system. And if the simple model predicts socioeconomic quantities with 80-90 percent accuracy, is there anything that can be said about the other 10-20 percent? Both of these questions suggest that one adjust for population, but using the power law model instead of per capita calculations to do so. West and his team did this on a set of 360 American cities:
“Amusingly, from this point of view, New York City as a whole turns out to be quite an average city, marginally richer than its size might predict (rank 88th income, 184th in GDP), not very inventive (178th in patents), but surprisingly safe (267th in violent crime). On the other hand, San Francisco is the most exceptional large city, being rich (11th in income), creative (19th in patents), and fairly safe (181st in violent crime). The truly exceptional cities are typically smaller … “
“This is just for a single year (2003), and it is natural to ask how any of this changes with time. Unfortunately, readily accessible data on all of these metrics are hard to come by prior to about 1960. However an analysis covering data over the last forty to fifty years reveals some intriguing results … Cities that were overperforming in the 1960s, such as Bridgeport and San Jose, tend to remain rich and innovative today, whereas cities that were underperforming in the 1960s, such as Brownsville, are still near the bottom of the rankings. So even as population has increased and the overall GDP and standard of living have risen across the entire urban system, relative individual performance hasn’t changed much.”
West notes that San Jose is the location of Silicon Valley, so rather than big tech explaining why San Jose punches above its weight, it is more likely that San Jose punching above its weight helps explain why Silicon Valley is where it is.
(As an aside, smaller entities being more exceptional is to be expected, is it not? The smaller the sample, the larger a deviation from the mean is plausible. Even a small county is a large sample, so maybe not, but 1. We are given only the relative rankings; no other metric is provided. And 2. If we view cities as a set of neighborhoods, rather than people (which seems reasonable, if what we’re interested in here is income, crime, and patents; neighborhoods de facto segregate with respect to the first two), then the size of each sample is not so large. The book says nothing more on how size affects the results than what I quoted above, so factor in high epistemological uncertainty to this assessment. But, I would be curious to see if increases (decreases) in relative population could predict movements toward (away from) the mean rankings of GDP and crime.)
This is a general audience book on science rather than history or sociology, and the emphasis is on informing rather than persuading. West occasionally delves into politics, mostly to advocate for sustainability, environmentalism, and acknowledgement of the dangers of exponential growth. But by my view his team’s findings about cities have powerful implications for political theory. This research is describing a strong and fundamental relationship between geography and productivity. We’ve all heard over the past few years the story that “big urban centers are the winners of globalization and low-population rural areas are missing out”. But this research is suggesting that it does not matter what any specific government does (short of abject totalitarianism – see N. Korea). Not only will bigger settlements always have higher crime and production per capita, it will be in amounts that are easy to predict with high accuracy. There’s room for “culture” to matter, since Japanese cities are distinct from American cities by these numbers. But good luck changing culture if you’re a mayor or a city council trying to improve your municipality.
As you might recall from one of the above passages, West himself disagrees and says that if policy makers are smart about the natural processes and take a view of decades instead of election cycles they can achieve great things. He spends pages elsewhere criticizing top-down planned cities like Brasilia, but evidently believes there are other policies out there that could guide a city constructively. I hope he’s right, but he doesn’t say anything about what these policies might look like, and based on the evidence this section focuses on I draw a different conclusion. If the over (under) -performing cities are the same as they were 50 years ago, then why would we expect that the policies of one city or another made any difference? Or an even better question, why would we expect a city’s politics to exist outside of the powerful generic forces being described here? There may well be aspects of city hall’s priorities that can be predicted based on the size of the city; after reading this book it wouldn’t surprise me. (What I’m trying to say here is, maybe it’s like Does Reality Drive Straight Lines On Graphs, Or Do Straight Lines On Graphs Drive Reality? but with y = k*(x^s) instead of y = mx + b.) West seems to take as his null hypothesis that the root cause for the differences in ranking is smarter policy. I look at the inflexibility in relative advantages and disadvantages over the course of a half century, and my own null hypothesis is that the root cause is nationwide self-sorting by class. On the other hand, maybe Geoffrey West just didn’t want to be controversial. And from a certain point of view, it is possible for smart and long-term-minded mayors and council members to be voted in and enact awesome policies that cut down on crime and generate wealth. It just never happens, because “socially/economically possible” is a much smaller space of events than “possible possible”. (see also WebMD And The Tragedy of Legible Expertise)
VI
Following the section on cities is a short section on companies. This time the data is very noisy, with lots of spread, but there are still observations to make. This will be brief because the theory is not nearly as well-explored as the biology and the study of cities, but:
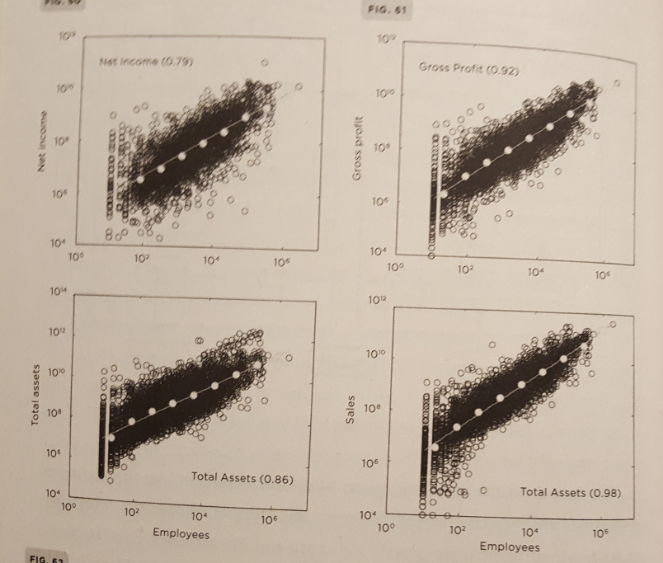
_Horizontal axis is log of number of employees in all cases; vertical axes are net income, gross profit, total assets, and sales. Data set is all 28,853 public companies in the United States between 1950 and 200_9
The odds that a company will disappear within a given time frame does not depend on how big it is. Nor how old (up to a point, back to this in a sec)
The fact that the chance that a company “dies” (is bought out or goes bankrupt) without regards to size means that we can meaningfully speak of a half life for companies; for publicly traded American companies it is currently around 10.5 years.
The rate of turnover of the Fortune 500 has increased. In 1958 the average lifetime of a spot on the Fortune 500 was measured 61 years; in 2017 it was 18 years. Note that falling off the list does not always mean bankruptcy or merger. It could just mean contraction.
The amount that a company spends on R&D as it increases in size decreases a proportion of the overall budget. This suggests (though does not show definitively) that administrative overhead outpaces adaptability as a company grows - no surprises there
A purely half-life decay theory would tell us that there are basically no companies older than 200 years. This is not true. From the book: “According to the Bank of Korea, of the 5,586 companies that were more than two hundred years old in 2008, over half (3,146 to be precise) were Japanese, 837 German, 222 Dutch, and 196 French. Furthermore, 90 percent of those that were more than one hundred years old had fewer than three hundred employees.” It goes on to give the examples of a German shoe store that for four centuries has always had only one location, and a Japanese hotel that “has been in the same family for fifty-two generations and even in its modern incarnation has only thirty-seven rooms”. I wish West had said something about banks, because some of them have been around a long time but, alas, he did not. Still, there’s something fascinating going on with these tiny businesses that know exactly what they want to do and never tempt fate by trying to expand.
VII
Other thoughts: In order to make a reasonably-sized review, I’ve left out several sections. I didn’t talk about the Zipf and Pareto distributions that show up in a couple places. I glossed over a long summary of mid-century qualitative theorizing about cities from figures like Jane Jacobs, glossed over the discussion of mortality, and ignored altogether an account of Isambard Kingdom Brunel. Nor have I recounted the findings about how many different types of businesses exist in a city of a given size. There is a charm to Scale which comes from Geoffrey West’s meandering connections to a multitude of fields and persons, as well as the reach of his research. There is also risk inherent to having the summary of such an ambitious and boundary-less project being authored by one man and placed in 450 pages. How can we be sure that everything discussed was presented fairly and appropriately fact-checked? I push back against West’s opinions in some places, but at no point did I push back against his facts or get a sense of Gell-Mann effect. Nonetheless, the subject is broad enough that I can imagine some detail in here being wrong. This is a terrible criticism because I like the broad reach of the book, and given the broad reach there’s absolutely nothing that could have been done differently so as to assure me on this front, but that’s the world we live in. I’m willing to overlook it anyway, on the grounds that most of what’s in the book is exposition of areas West has co-authored papers contributing to, and it’s pretty clear which parts are flavorful or an aside.
I can imagine_Scale_ receiving criticism from certain quarters because much of it is summary of existing knowledge rather than summary of original research. This doesn’t bother me at all. I never would have heard of allometry or of the average number of heartbeats being constant across all mammals if not for this book popularizing the phenomena. Moreover, the format of the book places the contributions from West and his co-researchers into a narrative context where the reader understands what came before and what the thought process was as West moved from work in physics to work in biology to work in sociology. West is a strong believer in polymaths and multi-disciplinary work, and the structure of the book does a good job helping him make this case. And to comment here, I don’t want to wade too deep into a debate on polymaths, but I know the word gets a bad rap in some places. I’ll just remind those people that Geoffrey West isn’t being a hobbyist here; he works for the Santa Fe Institute, and the research summarized here was published in various journals. If you want to know more, get ahold of a copy of the book and rummage through the appendix. Or read about the Santa Fe Institute; multi-disciplinary research is their shtick. While I’m on this subject, I’d also like to stress that West expresses plenty of appreciation and respect for the people who worked with him. He’s not taking full credit for something that was a collaboration. I do get the sense that he took initiative in organizing the collaborations, but other than that he just happens to be the member of the team who wrote a book for the general public.
The one notable complaint I do have involves the discussions of sustainability. If one looks at the past couple centuries there is an obvious population explosion. Obviously, we haven’t all collectively run out of food yet; we keep innovating and coming up with ways to feed the growing quantity of humans on the planet. But exponential growth is fast and terrible, meaning that we have to keep coming up with paradigm-shattering technologies. This provides evidence that a version of the Malthusian argument is going to be correct at some point. To this end West repeats the Kenneth Boulding quote that “Anyone who believes that exponential growth can go on forever in a finite world is either a madman or an economist.” By itself I don’t find this controversial. The assumption that there will be always be paradigm-shattering technologies to discover is debatable, and then there is West’s more technical argument that there has to be ever-decreasing amounts of time between those discoveries in order to prevent disaster.
The trouble I have with the Malthusian line is that the most prosperous countries aren’t seeing explosive growth. The First World has birth rates that barely keep up with deaths. I’m open to arguments that this is not a permanent state of affairs, but Scale does not make any. Maybe this is because it is too busy responding to an Austrian School viewpoint of eternal optimism that I already disagreed with.
In the end this is a minor disagreement with the book and I’m glad that the book was written. I would love to see more literature along this line – math and physics style analysis of large scale human interaction. Certainly the results here are evidence that it’s worthwhile to investigate.